The biggest problem for any e-commerce platform in any segment is to standardise the images with good quality. DriveX is no different. Since, we are rapidly growing and our business is dependent on the refurbishment centers. Post refurb, the images of the vehicles are captured and pushed to the database. There are a lot of problems we have to standardise the images for our business
Unlike E-commerce, our every bike is unique , so we cannot go with stock images
With Growing outlets, the images of the bikes are randomly captured with different backgrounds and angles
Most of the times, the sequence how the images are captured is not properly streamlined
Cost and time to setup process, follow the SoP is very high considering the type of stakeholders we are working with
The images while coming to the website creating bad user experience and low CTRs
So, what have we done ?
Product and engineering wanted to solve the problem with limited dependency on the business, sales or operating verticals.
We came up with a fully automated process to solve the problem along with Cost, Speed and Complexity.

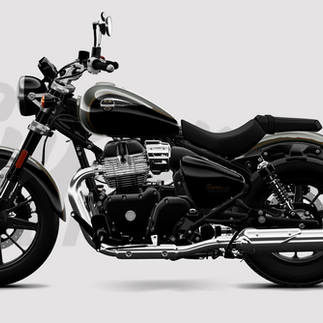
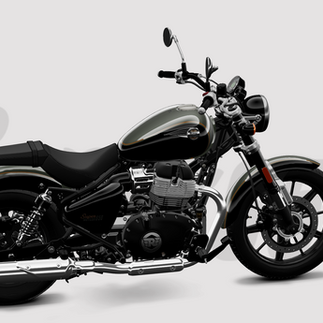
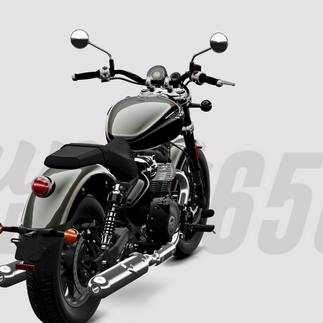
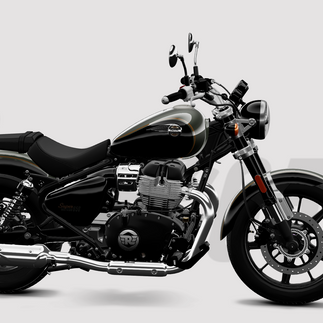
Lets Say, we have a given set of images uploaded in the database for a given vehicle like below -
Preprocessing:
Resize images to a standard size.
Normalize the image data.
We can do this using standard image processing tool.
Now, we need to ensure that we have identified the right angle of each of these images for which we have used :
Image Classification technique:
Use a pre-trained Convolutional Neural Network (CNN) model (e.g., ResNet, VGG) fine-tuned for vehicle image classification.
Classify images into predefined categories (front view, back view, left view, right view, etc.)
Image Description | File Path |
Side View (Right) | /mnt/data/Screenshot 2024-07-20 at 1.01.29 AM.png |
Side View (Right, Slightly Angled) | /mnt/data/Screenshot 2024-07-20 at 1.01.37 AM.png |
Rear View (Slightly Angled) | /mnt/data/Screenshot 2024-07-20 at 1.01.43 AM.png |
Rear View | /mnt/data/Screenshot 2024-07-20 at 1.01.48 AM.png |
Rear View (Slightly Angled) | /mnt/data/Screenshot 2024-07-20 at 1.01.53 AM.png |
Side View (Left, Slightly Angled) | /mnt/data/Screenshot 2024-07-20 at 1.01.58 AM.png |
Side View (Left) | /mnt/data/Screenshot 2024-07-20 at 1.02.04 AM.png |
Front View (Slightly Angled) | /mnt/data/Screenshot 2024-07-20 at 1.02.09 AM.png |
Front View | /mnt/data/Screenshot 2024-07-20 at 1.02.15 AM.png |
Side View (Right) | /mnt/data/Screenshot 2024-07-20 at 1.02.15 AM.png |
Arranging the images
As we know the sequence to be followed, I will simply re-arrange the images using pre-defined rules
Vehicle Color Identification
Objective: Identify the primary color(s) of the vehicle.
Steps:
Color Detection:
Convert images to the HSV color space for better color segmentation.
Use color clustering (e.g., K-means clustering) to identify dominant colors.
Map detected colors to standard color names.
Part | Color | Description |
Main Body and Tank | Predominantly Black | The main body and tank of the bike are predominantly black. |
Accents | Silver/Gray | There are silver/gray accents, particularly on the tank and engine area. |
Exhaust Pipes | Chrome/Silver | The exhaust pipes are chrome/silver. |
Minor Details | Orange (Turn Signals) | There are also some minor details in orange, like the turn signals. |
Based on the picked color, we need to define the color which matches the body
Vehicle Body Color | Background Color |
Black | White |
Dark Gray | |
Red | |
Silver/Gray | Dark Blue |
White | |
Dark Gray | |
Chrome/Silver | Dark Green |
Dark Blue | |
Black | |
Orange | Blue |
White | |
Dark Gray |
These inputs will go the prompt to change the background of the vehicle for example :

If we have enough images provided by the uploader, we can also create a
360-Degree View by
Arrange images in sequence.
Using MoviePy.
Category | Metric | Impact |
Customer Engagement Metrics | Click-Through Rate (CTR) | Higher CTR on vehicle listings |
Customer Engagement Metrics | Time on Page | Increased time users spend on each listing page |
Customer Engagement Metrics | Bounce Rate | Reduced bounce rates |
Conversion Metrics | Conversion Rate | Higher conversion rates |
Conversion Metrics | Lead Generation | Increased number of inquiries and leads generated |
Operational Efficiency Metrics | Processing Time | Reduced time required to prepare images for listings |
Operational Efficiency Metrics | Manual Effort | Decreased manual effort in processing and standardizing images |
Operational Efficiency Metrics | Error Rate | Reduced error rates in image categorization and standardization |
Sales Metrics | Sales Volume | Increased overall sales volume |
Sales Metrics | Average Selling Price | Higher selling prices |
User Satisfaction Metrics | Customer Satisfaction Score (CSAT) | Improved overall customer satisfaction |
User Satisfaction Metrics | Net Promoter Score (NPS) | Higher likelihood of recommendations, increasing NPS |
Website Performance Metrics | Page Load Time | Improved page load times |
Website Performance Metrics | Mobile Performance | Enhanced mobile user experience |
Brand Perception Metrics | Brand Trust | Increased trust in the brand |
Brand Perception Metrics | Brand Recognition | More recognizable and reliable brand image |









Comments